SPECIAL LIBRARY SOLUTIONS
LibInsight
Data-Driven Insights About Usage of Library Resources and Services
Affordable, Easy-to-Use Library Analytics
Simplify Data with Customizable Datasets
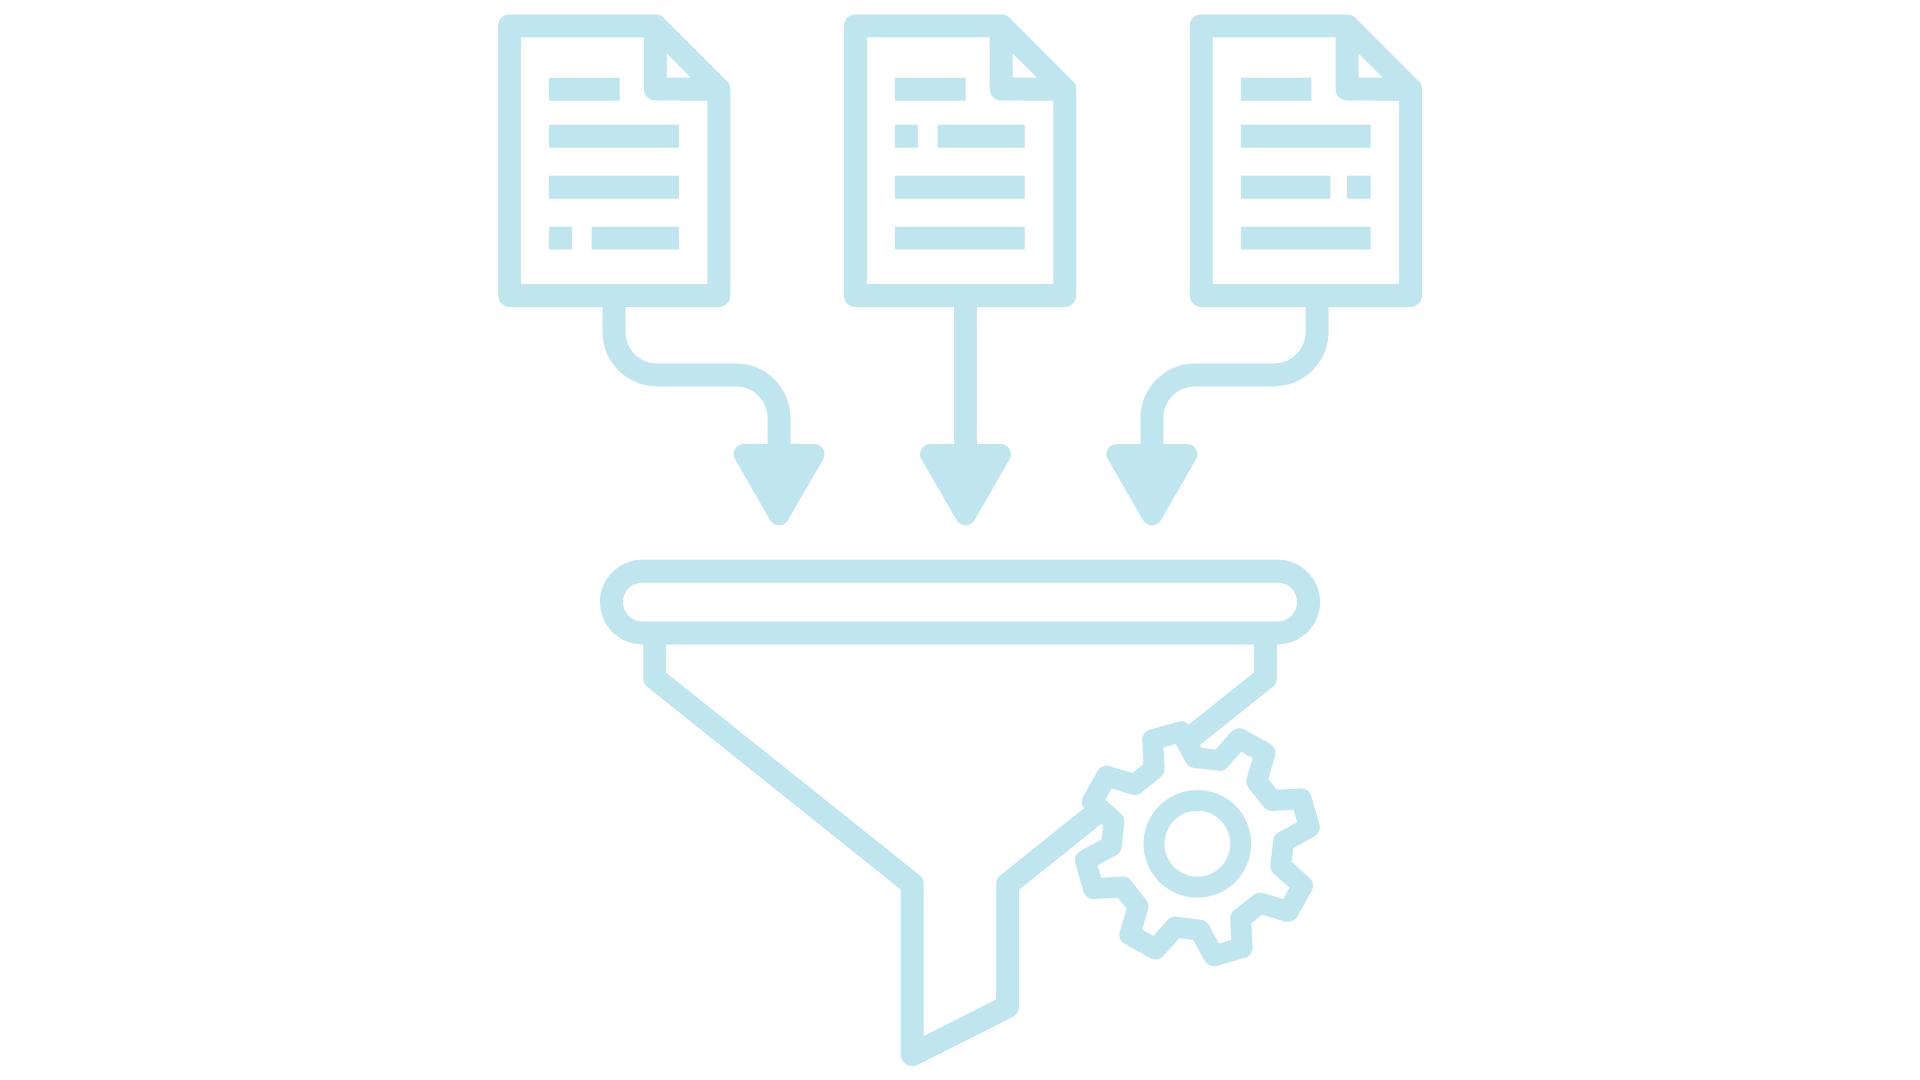
Easily collect, manage, and analyze data with customizable datasets, designed to meet the unique needs of every library.
- Unlimited Tracking: Create and manage as many datasets as needed to analyze all aspects of your library.
- Flexible Options: Use pre-built datasets or design custom ones to suit your library’s unique needs.
- Actionable Insights: Gather and analyze data like gate counts and resource usage for informed decision-making.
- Controlled Access: Admins can set user permissions to manage who can input data and run reports.
Uncover Insights with Cross-Dataset Analytics
Gain a deeper understanding of your library's needs by seamlessly connecting and analyzing data from various sources.
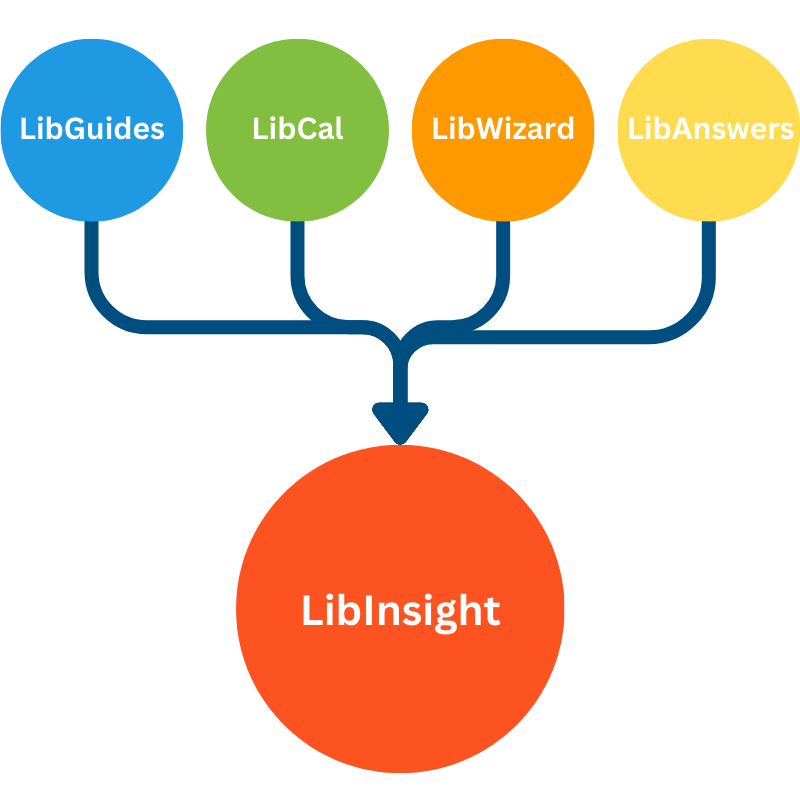
- Centralized Data Storage: Route all of your statistical data into one platform for improved synergy.
- Unified Insights: Make connections, uncover trends, and easily collaborate with other departments.
- Informed Decision-Making: Use analytics to evaluate resource usage, expenditures, circulation, and more.
- Comprehensive Insights: Gain a complete view of your library’s performance by analyzing data from multiple datasets.
COUNTER 5 with SUSHI Integration
Manage and analyze electronic resource usage with COUNTER 5 reporting and SUSHI integration for accurate, automated insights.
- Complete Metrics Tracking: Monitor downloads, searches, and access patterns with COUNTER 5 reports.
- Automated Data Harvesting: Use SUSHI integration to automatically gather usage data without manual effort.
- Accurate Resource Insights: Analyze detailed usage data to evaluate the impact and effectiveness of your databases and online resources.
- Time-Saving Integration: Streamline e-resource management with automated, reliable data collection processes.
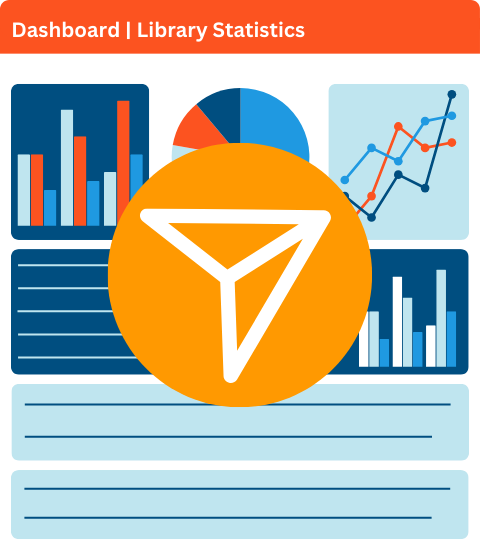
Visualize Your Impact with Interactive Dashboards
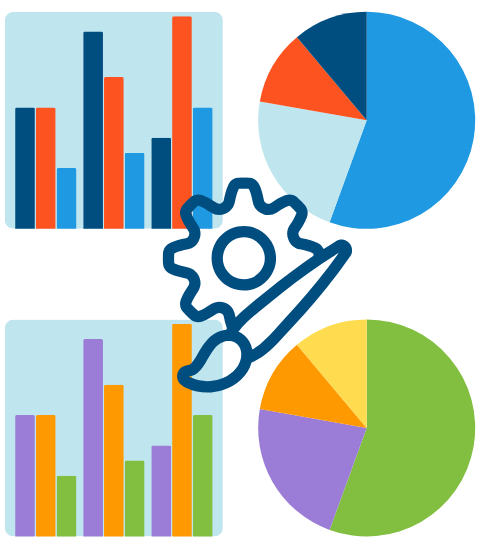
Highlight your library’s value with interactive dashboards that make data accessible and impactful for your stakeholders.
- Custom Dashboards: Create personalized pages to display key metrics in an easy-to-understand, shareable format.
- Internal Insights: Share library statistics and data internally, enabling staff to make informed, data-driven decisions.
- External Impact: Feature public-facing dashboards to highlight library usage, such as gate counts, and database or resource usage.
- Data Visualization: Transform your data into stunning infographics to share with board members and other stakeholders.
Import Data Directly From Your Springshare Tools
Your LibApps tools are already collecting valuable data—why not put it to work? With LibInsight, you can effortlessly import statistics from your other LibApps to centralize your data for deeper analysis. Save time, ensure consistency, and uncover actionable insights all in one place.
The LibGuides dataset enables libraries to dive deep into their website’s usage patterns by tracking essential metrics like the total number of public page views, user sessions, and the ratio of published guides to total guides.
By understanding how frequently users engage with guides and which resources are most accessed, libraries can make informed decisions about available resources, outreach strategies, and identify areas for growth.
By connecting your LibCal system to your Calendaring dataset, libraries can seamlessly sync their space booking and equipment booking data.
This integration provides libraries with an up-to-date overview of space utilization, helping track trends, measure user needs, and identify high-demand resources for more effective forecasting.
The LibWizard dataset gives libraries the ability to import data from their LibWizard forms, surveys, quizzes, and tutorials, enabling in-depth analysis of submissions and usage patterns.
Libraries can track how frequently submissions come in and evaluate response trends over time. By analyzing this data, libraries can refine their services, identify gaps in user needs, and improve the efficiency of their form-based processes.
By connecting your LibAnswers system to your Reference dataset, libraries can automatically track a wide range of interactions, including ticket submissions, FAQ views, and LibChat sessions.
This integration offers valuable insights into user engagement and service usage, enabling libraries to assess the effectiveness of their reference services. With detailed data on user inquiries and response trends, libraries can make informed decisions about staffing, resource allocation, and areas for improvement.
Import Data From Other Sources
LibInsight offers flexible options for collecting and importing data, making it easy for libraries to track and analyze statistics across all library operations. Whether you’re using pre-built or custom datasets, LibInsight provides a range of flexible methods for data collection and import.
For e-resource usage tracking, LibInsight supports COUNTER 5-compliant datasets. Analyze database, e-journal, and eBook usage by automatically retrieving data directly from vendors via SUSHI harvesting. This automation saves time and ensures accuracy.
For data analysis on acquisitions, circulation, gate counts, interlibrary loans, and more, you can easily upload spreadsheets of exported data from your ILS or other systems. LibInsight’s user-friendly interface guides you through mapping data for seamless integration.
When automation isn’t possible, LibInsight allows for quick manual entry of data. This is ideal for custom datasets, reference tracking, or any scenario where data needs to be entered on an as-needed basis.
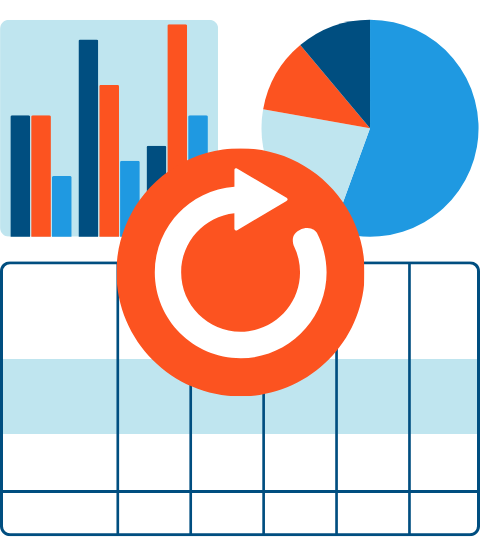
Interactive Dashboards: Turn Data Into Insights
LibInsight’s Interactive Dashboards help libraries turn raw data into actionable insights with customizable visualizations and real-time updates. Designed for librarians, the intuitive dashboard builder makes it easy to create professional-looking dashboards without any technical expertise, highlighting key metrics and sharing data-driven stories effortlessly.
Data Consolidation
Essential Features at an Affordable Price
All Your Data Together
Qualitative Data Collection
Customizable Reporting
Private & Secure
Serendipitous Discovery
Pre-Built Datasets
Ready for the Next Steps?
We'd love to show you how LibInsight can help with your library's data collection and analysis. Contact us for examples of real-world usage and to organize a demo for you and your colleagues.