- The LibGuides dataset allows you to analyze the total number of public page views, user sessions, and published vs. total guides
- Connect your LibCal system to your Calendaring dataset to sync your aggregate event, appointment, space booking, and equipment booking data automatically
- The LibWizard dataset allows you to import information about form submissions from your LibWizard site for in-depth analysis of how your forms are used
- Connect your LibAnswers system to your Reference dataset to automatically keep track of the number of tickets, FAQ views, and LibChat sessions
LibInsight
Affordable, flexible, powerful analytics tool for libraries, with counter & SUSHI support, custom dashboards, and more!
Library Data Analytics Platform
LibInsight’s data collection and visualization tools are designed to help libraries make data-driven decisions, demonstrate organizational value, and more! Build dashboards and share statistics with stakeholders. Create shareable datasets for recording data within and outside your organization.
Key Features
- Unlimited dataset creation & analysis
- Easy cross-dataset comparison reports
- Pre-built datasets for e-resources, circulation stats, acquisition analytics, budget analysis, and gate counts
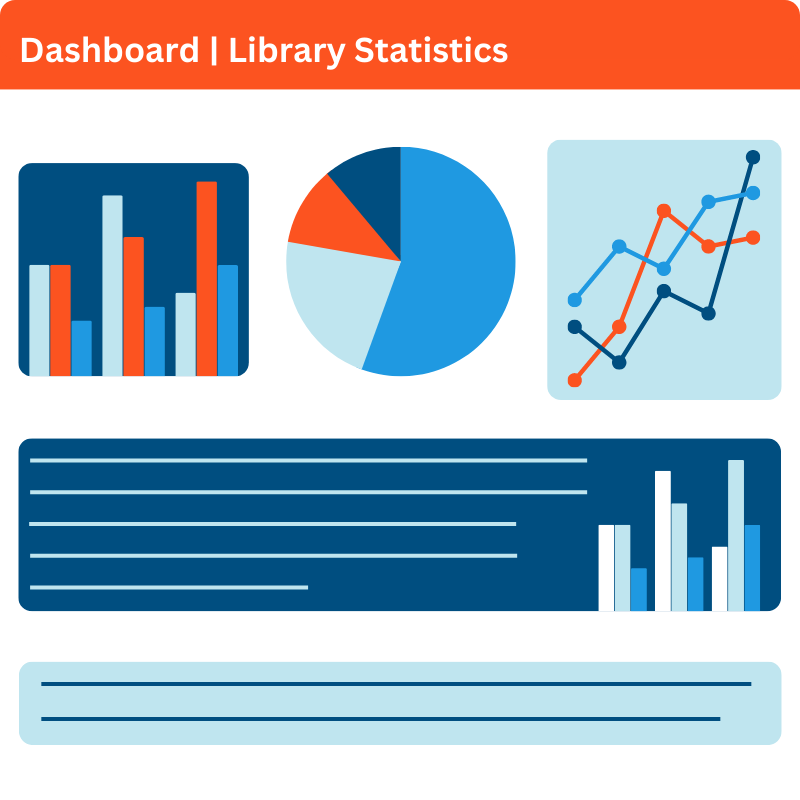
- Dashboards with auto-updating infographics showing library's usage metrics
- Collect and analyze all library data in one place
Gather Statistics. Analyze Trends. Assess Services.
Get started with creating Custom Datasets and Interactive Dashboards with LibInsight Lite. LibInsight Lite is a "lite" version of the full LibInsight system. As your analytics needs grow, you can easily update to the full LibInsight platform.
Organize and consolidate all library data and statistics in one place for cross-dataset analysis. Store and analyze all of your library data by importing your ILS, E-Database/E-Journal platforms, Google Analytics data (and more!) into one system.
Create and set up an unlimited number of datasets to collect and analyze data for all aspects of your library! Choose from a variety of pre-built yet customizable datasets or create your own custom datasets from scratch for your unique needs.
Electronic resource management is now even easier with Counter r5 reporting metrics. Upload and analyze your data using COUNTER 4 & 5 reports or connect to a growing number of SUSHI providers to import data directly from vendors.
Store all your statistical data in LibInsight and view relationships and correlations among previously siloed datasets. Cross-dataset analytics help with effective assessment and evaluation of library services. Collect and store data from disparate sources in one place for convenient analysis.
Dashboards allow you to create an unlimited number of shareable custom pages that provide a broad overview of the library's metrics. Dashboards can be used internally, or create public-facing dashboards to give your community real-time insight into library usage.
Support for COUNTER 5 Analysis & SUSHI Protocol
LibInsight’s E-Resources/COUNTER 5 Dataset allows you to analyze e-journal, eBook, and database usage from COUNTER 5-compliant vendors. You can manually import your data via SUSHI single fetch, or set up a schedule for LibInsight to harvest these reports automatically.
This dataset takes all the guesswork out of the equation by gathering data from all Master-level reports. By supporting the Master Reports, LibInsight supports just about everything that has to do with COUNTER r5 reporting.
Create Interactive Dashboards Showing Library Usage
Drag-and-Drop Dashboard Builder
Easily build visually appealing dashboards with various chart types to project relevant usage statistics.
Shareable Dashboards
Create dashboards with their own URLs and then share the links with the community and/or relevant stakeholders.
Real-Time Updates
Once the dashboards are built, the underlying datasets are updated automatically which then updates the charts in real-time.

Ingest Data From Your Springshare Tools
Importing data from your Springshare tools makes it easy to perform cross-dataset analysis and spot actionable trends.
Ready for the Next Steps?
We'd love to show you how LibInsight can help with your library's data collection and analysis. Contact us for examples of real-world usage and to organize a demo for you and your colleagues.